Diesel Theft Ends When You Electrify — And The New Energy Leakage That Replaces It
By YoMobility Team7 min read
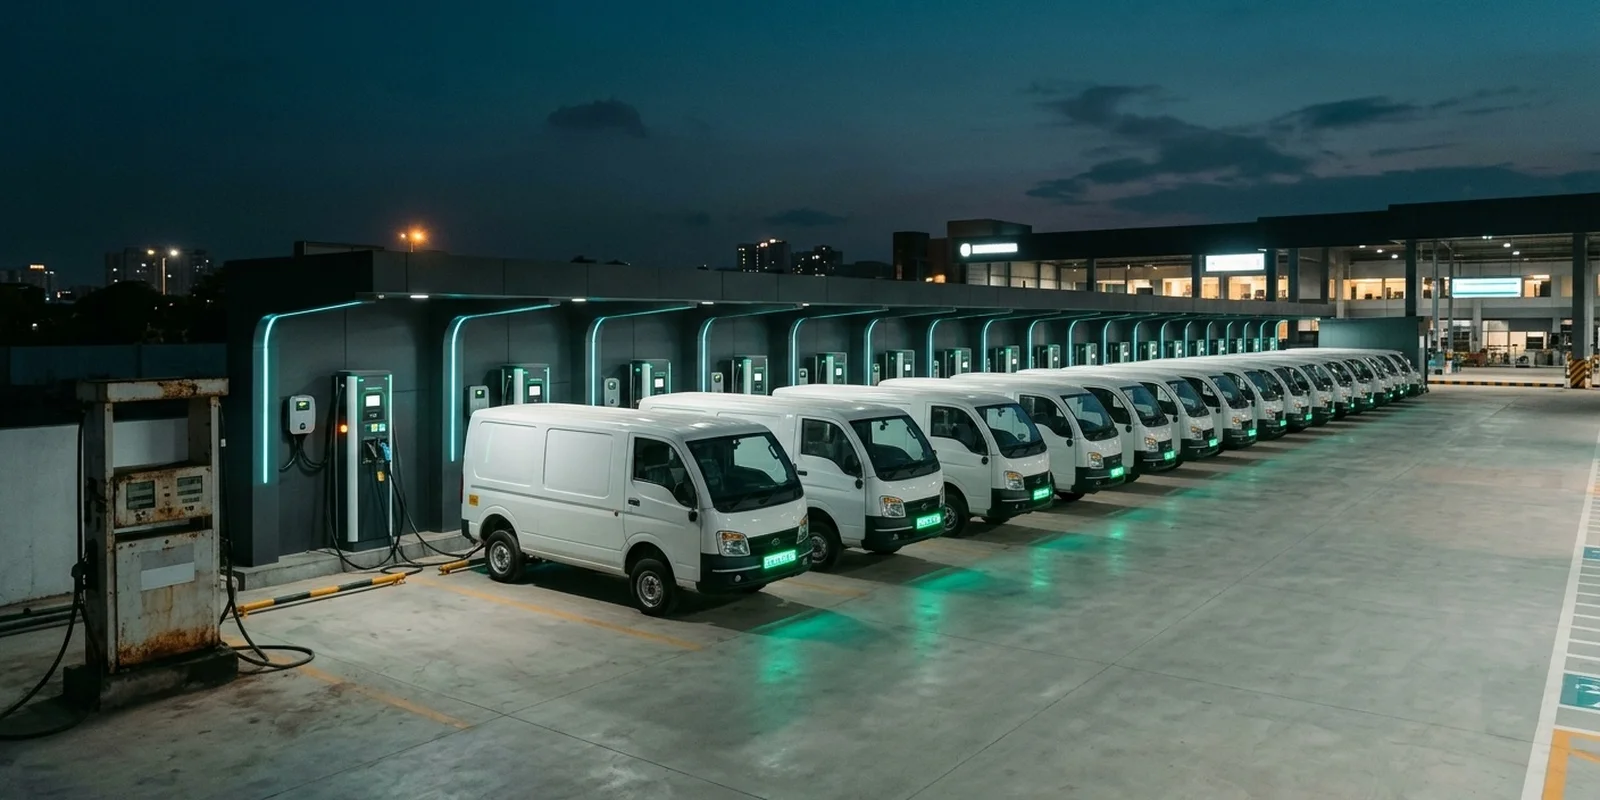
Diesel Theft Ends When You Electrify. Energy Leakage Doesn’t.
💡 Diesel Theft vs EV Energy Leakage: Key Highlights
- Diesel theft survives every control because fuel is liquid, resellable and untraceable once it leaves the tank.
- Each 1% that leaks costs ₹12,376 a month on an illustrative 50-van depot burning 13,000 litres at ₹95.20 a litre (Delhi price, Business Today, 11 Nov 2026).
- Electricity is metered at every hand-off, so leakage becomes a reconciliation exception, not a mystery.
- Three new leak paths replace the old ones: depot chargers, fleet credentials and home-charging claims.
- The control that matters is one daily check: kWh delivered per vehicle against km driven × expected kWh per km.
If you searched for how to stop diesel theft, here is the straight answer first: on a diesel fleet you can make it harder, but you cannot make it go away. Locking caps, fuel sensors, fuel-card rules and dip checks all fight a liquid that is easy to siphon, easy to sell and impossible to trace.
Electrification changes the opponent. Electricity is metered by default at every point it changes hands: at the depot charger, at a public charger and at the driver’s home meter. That does not make leakage impossible. It makes it countable, which is a much easier problem to win. This guide is for owners and depot managers of diesel last-mile and LCV fleets weighing electrification, and for EV fleet operators who assume the problem left with the fuel tank. It didn’t. It changed shape.
Why Diesel Theft Is So Hard To Stop
Diesel theft is a structural problem before it is a people problem. Fuel is the biggest variable cost on a commercial vehicle and has a ready informal market. Diesel still dominates the vehicles most delivery fleets run: the ICCT found that diesel held roughly 70% of India’s light commercial vehicle sales after BS VI, rising to 73% in FY24.
The four loss paths
- Siphoning. Fuel is drawn from the tank at night halts, at dhabas or inside the yard, in amounts small enough to hide inside normal consumption variation.
- Short-filling at the pump. The bill says 60 litres and the tank gets 52.
- False distance claims. An inflated odometer reading or trip log makes a high fuel draw look like honest mileage.
- Reimbursement inflation. Cash fill-ups away from the fuel-card network, backed by receipts nobody can check.
Why detection always lags
Every conventional control looks backwards. A dip check says a tank is short, not where the fuel went. A monthly report says a van averaged 10.8 km per litre instead of 12, but can’t separate theft from traffic, load or idling. Fuel sensors narrow the window, yet still infer volume from a probe in a sloshing tank. By the time an exception is solid enough to act on, the money has gone.
What Diesel Theft Costs A 50-Van Depot
We won’t quote an industry-wide theft percentage. Most circulating figures are vendor estimates with no named, dated source. Here is the arithmetic for a 50-van last-mile depot in Pune instead, so you can swap in your own numbers.
| Line | Value | Register |
|---|---|---|
| Fleet | 50 diesel delivery vans, one depot | Assumption |
| Daily distance | 120 km per van, 26 working days a month | Assumption |
| Fuel economy | 12 km per litre | Assumption |
| Diesel price | ₹95.20 per litre | Stated: Business Today, Delhi, 11 Nov 2026 |
| Monthly diesel volume | 13,000 litres | Derived: 50 × 120 ÷ 12 × 26 |
| Monthly diesel spend | ₹12,37,600 | Derived |
| Cost of every 1% that leaks | ₹12,376 a month, about ₹1.49 lakh a year | Derived |
| If 5% leaks | 650 litres, ₹61,880 a month, about ₹7.43 lakh a year | Derived (5% is an assumption, not a benchmark) |
The uncomfortable part isn’t the size of the number. It’s that you can’t tell which row is yours: a depot losing 2% and one losing 6% produce fuel bills that look almost the same.
What Changes When The Energy Is Electrons
Electrifying ends diesel theft outright: no tank to siphon, no attendant to short-fill, no jerrycan market for kilowatt-hours. The bigger change is what takes its place. Every kWh an EV receives crosses a meter that someone else reads too: your depot charger, a public charge point operator’s charger, or the driver’s household meter.
Networked chargers report each session’s meter values, energy delivered, credential and timestamps, data the Open Charge Point Protocol (OCPP) was built to carry. So the question stops being “did fuel go missing?” and becomes “does the energy we paid for reconcile against the distance we drove?”
Energy per km is also a number you can plan around. In the ICCT’s Delhi truck analysis, a 16-tonne electric truck was modelled at 0.94 kWh per km against 25 litres per 100 km for its diesel equivalent. Telematics adds a second witness: the vehicle reports its own state of charge.
| Question | Diesel fleet | Electric fleet |
|---|---|---|
| Where is energy measured? | Pump dispenser, then a tank sensor that infers volume | Charger meter, for every session |
| Who else holds the record? | A pump receipt, often on paper | The charge point operator’s session record or the DISCOM meter |
| What is it attributed to? | The vehicle, if the receipt is honest | A credential, a charger and a time, per session |
| How fast can you spot a loss? | Weekly to monthly, by inference | Next day, by reconciliation |
The Three New Energy Leakage Paths In An EV Fleet
EV leakage is smaller in rupees and easier to catch, but real. Teams usually find it in three places.
1. Unauthorised use of depot chargers
An open depot charger is a free tap for staff cars, a neighbour’s scooter or a driver’s own EV on a Sunday. Require a fleet credential for every depot session and map each charger to its allowed vehicles, so a session with no fleet vehicle attached shows up as an exception.
2. Fleet credentials used for non-fleet charging
A shared card or a stray app login can pay for charging a vehicle you don’t own. The control is a per-driver credential tied to a vehicle, with spending limits. Our guide to the RFID card for EV charging fleets covers which credential to issue. Card and Plug & Charge options depend on what each network supports. The rule here: no session is billable without a named driver and vehicle.
3. Padded home-charging reimbursement claims
Where drivers charge at home, a flat allowance or a smart-plug screenshot invites padding. A claim of 25 kWh for a day the van drove 90 km can be tested against the vehicle’s own data. Our driver home charging reimbursement playbook sets out the workflow; for leakage, check every claim against distance driven before paying it.
The Energy Reconciliation Every EV Fleet Should Run
One formula, run per vehicle per day, replaces the dip stick.
The daily energy check
Expected kWh = km driven × expected kWh per km (per model, adjusted for load and season)
Variance = kWh delivered (depot + public + home) − expected kWh
Flag any vehicle whose variance sits outside the tolerance band you set, for example ±15%
Run it on the same depot, now electric. At an assumed 0.16 kWh per km and 120 km a day, each e-van should draw 19.2 kWh, or 24,960 kWh a month across 50 vans (Derived). At ₹11.44 per kWh, the all-in cost the ICCT assumed for Delhi, that is about ₹2,85,542 a month (Derived). A van drawing 23 kWh for 120 km is about 20% over and gets flagged next morning. A fleet-wide 5% leak, 1,248 kWh or ₹14,277 a month (Derived), arrives with a charger, credential and timestamp attached.
The controls that make the numbers audit-grade
- Per-driver credentials mapped to vehicles, so every session has an owner.
- Charger-level metering at the depot, not just the building’s DISCOM meter.
- Invoice reconciliation across every network you charge on. A consolidated charging invoice split by vehicle, driver, station and tariff makes it routine; unified invoicing across multiple CPOs covers the mechanics.
- Exceptions surfaced automatically: a daily variance list with alerts routed to the depot manager, not a month-end report. Energy-per-km and related definitions are in our EV fleet KPIs guide.
A fleet operating system like YoMobility puts multi-network charging sessions, telematics and per-driver limits into one ledger, so kWh-versus-km variance sits in your fleet analytics next to cost per km. In practice, teams run this on a multi-network fleet charging and invoicing platform, not month-end spreadsheets.
Frequently Asked Questions
Sources: Business Today: Delhi diesel price (11 Nov 2026) | ICCT: LCV fuel consumption in India (Nov 2024) | ICCT: Electric trucks in Delhi EV Policy 2.0 (Jun 2023) | Open Charge Alliance: OCPP
Manage Your Fleet’s Energy Reconciliation Today
See kWh delivered against km driven for every vehicle, every day.
Book a Free DemoYoMobility EV-FMS
EV fleet management softwareRun every vehicle, driver, charge and payment from one platform. Charge on multiple networks, and get one invoice for all of it.
Resources
Keep reading
Green Number Plates For Commercial EVs: Registration, Permit Exemption And What Else Changes
💡 Green Number Plate: Key Highlights Green plates with yellow lettering identify commercial battery-electric vehicles; white lettering means private use. […]
Driver Monitoring System For EV Fleets: What The Camera Sees And What It Should Change
💡 Driver Monitoring System: Summary A driver monitoring system is usually bought as a camera and judged on detection: does […]
EV Battery Replacement Cost For Fleets: What Drives The Quote — And When Replacing Is The Wrong Call
💡 EV Battery Replacement Cost: Key Highlights The EV battery replacement cost is the largest single repair bill a fleet […]
See YoMobility on your fleet
Tell us how many vehicles you run and where they charge. We'll show you how they'd run on one platform, with one invoice.
Or contact us