EV Fleet Daily Operations: An Hour-By-Hour Look At Three Indian Fleets
By Shaurya Rathore13 min read
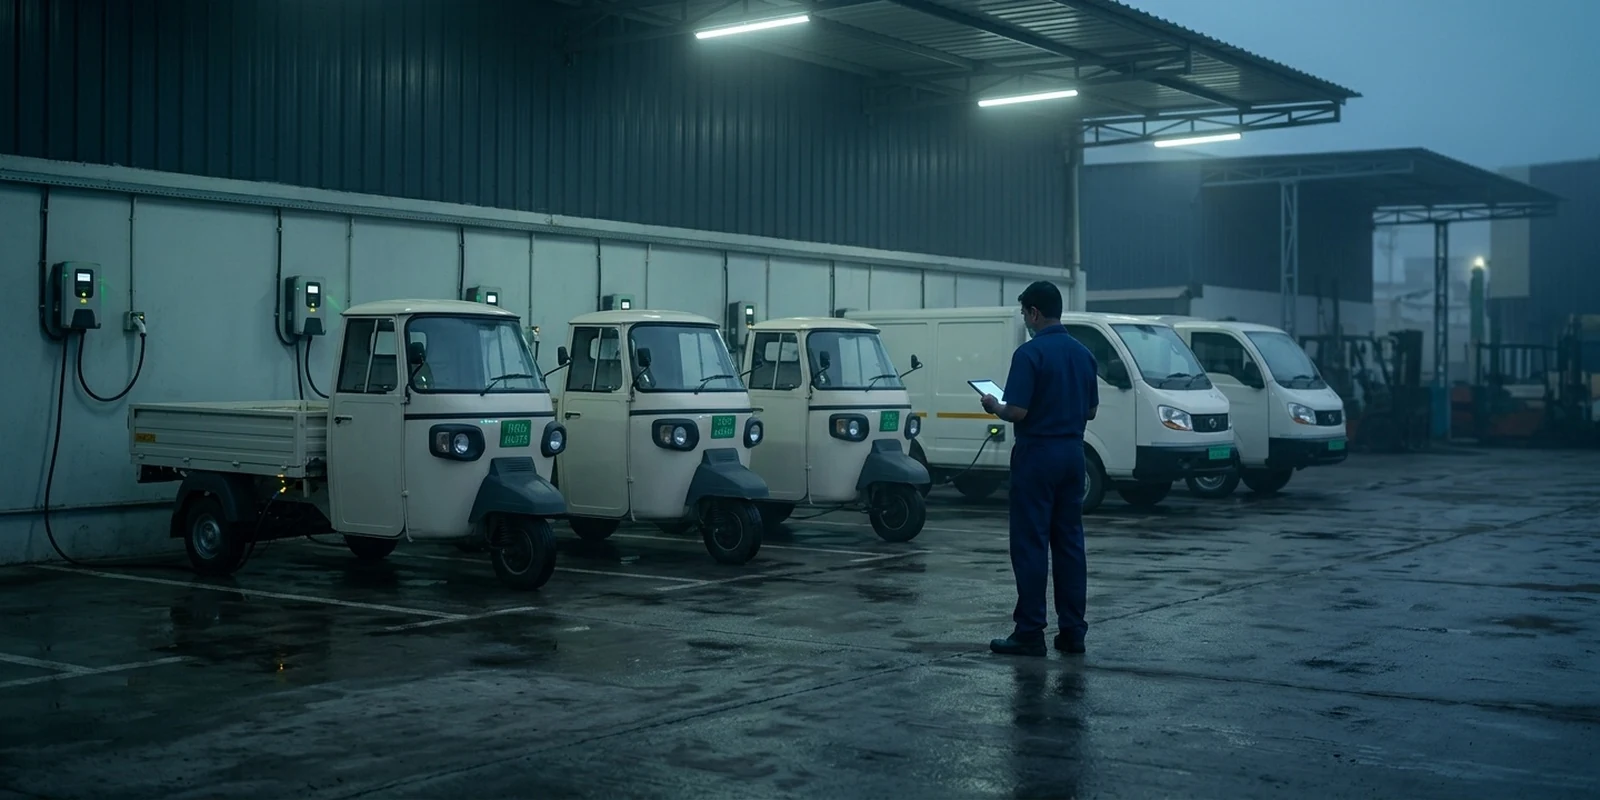
EV Fleet Daily Operations
💡 EV Fleet Daily Operations: Key Highlights
- Electrification is already the default in last-mile. India sold close to 800,000 electric three-wheelers in 2025 — nearly 70% of all three-wheeler sales — so most supervisors now run an electric shift, not a pilot.
- Each segment optimises a different number. Last-mile chases cost per drop, taxi fleets chase revenue-hours per charge, corporate transport chases on-time arrival.
- Energy is now priced by the hour. Under India’s Time of Day rules, peak power for commercial consumers is at least 1.2× the normal tariff while solar-hour power is at least 20% cheaper — a daily scheduling decision, not a procurement one.
- Charge sequencing beats charge speed. A 60-vehicle depot with 24 charge points runs roughly three overnight waves; which vehicle lands in which wave is the highest-leverage decision of the night.
- Five decisions repeat in every segment: charge sequence, SOC-versus-route, exception triage, payment approval, and end-of-day reconciliation.
Strategy decks do not run fleets — shifts do. EV fleet daily operations are settled in a few dozen small moments a day: which van gets the last free charge point at 14:10, whether a driver’s home-charging claim is genuine, whether 22% battery at 16:00 finishes the route or strands it 9 km short. Get those moments right and the electrification business case you signed off actually lands in the P&L. Get them wrong and you have bought quieter vehicles with worse utilisation.
This post is deliberately tactical, and it is written for three specific roles: a last-mile supervisor, an urban taxi fleet manager, and a corporate transport coordinator. Where our EV fleet case studies covered why each segment’s business case works, this one walks the clock — what each person actually looks at, decides, and approves between the first depot check and the last vehicle plugged in for the night.
Why EV Fleet Daily Operations Look Nothing Like A Diesel Shift
A diesel shift treats fuel as a solved problem. The pump is always open, refuelling takes six minutes, and any vehicle can take any route because energy is fungible. Electrification removes all three assumptions at once, and that is what makes EV fleet daily operations a genuinely different job rather than the same job with a new fuel line on the ledger.
Electric three-wheelers sold in India in 2025, up 15% year on year — the vehicle class that carries most last-mile fleets.
Share of all Indian three-wheeler sales that are now electric, largely displacing CNG.
Minimum peak-hour multiplier and minimum solar-hour discount under India’s Time of Day tariff rules for commercial consumers.
Fuel becomes a schedule, not a stop
A depot has a fixed number of charge points and a fixed number of hours between the last return and the first dispatch. Multiply them and you get the night’s real energy budget: 24 points across a seven-hour window is 168 point-hours, and if the fleet needs 190, no amount of driver goodwill closes the gap. The daily job is fitting demand into that box by sequencing.
Energy price now moves by the hour
India’s Time of Day framework sets commercial peak tariffs at a minimum of 1.2 times the normal rate and solar-hour rates at least 20% below it — roughly a 40% spread on the same kilowatt-hour. For a fleet drawing 500 kWh a night, charging in the wrong window is a recurring, self-inflicted cost no annual procurement round recovers. Your supervisor makes that call daily.
Readiness becomes a number you can see before the shift
This is the compensation for the added complexity. A diesel supervisor cannot know at 05:15 which vehicles will underperform; an electric one can. State of charge, last night’s completed session, and each vehicle’s consumption against its own seven-day baseline are all visible before anything moves. A fleet operating system like YoMobility exists to turn that visibility into a decision queue — the EV fleet management platform assembles those signals into one morning view.
05:15 To 21:00: A Last-Mile Supervisor’s Day (60 e-3Ws, Delhi NCR)
Our supervisor runs 60 electric cargo three-wheelers out of a Delhi NCR depot with 24 charge points, averaging 85 km and roughly 70 drops per vehicle per day. Her scorecard has exactly one headline number on it: cost per drop.
57 of 60 vehicles finished above 95%. Of the three that did not, two were third-wave vehicles that only plugged in at 03:40 and one is a genuine fault on point 14. Three lookalike alerts, three different responses: short routes for the late pair, a maintenance ticket for the point, the standby vehicle pulled forward.
The two vehicles at 78% take the dense colony beats of 40–45 km. The 96 km outer-Noida run only goes to a vehicle above 95% — a three-wheeler that runs short at kilometre 80 does not just lose its own drops, it consumes a second vehicle’s afternoon.
Vehicle 27 reports 61% at 34 km covered, roughly 18% above its own seven-day average on comparable routes. That pattern is rarely driver behaviour; it is load, tyre pressure or a dragging brake. Today it costs one inspection slot. In three weeks it costs a breakdown.
Solar-hour tariffs apply through the middle of the day. Every vehicle back at the depot in that window is plugged in on a standing rule, not a case-by-case call. On a 500 kWh night, shifting even 90 kWh into the solar window is margin the fleet collects for free.
The question is never “can this vehicle finish?” but “can it finish and get back?” Two vehicles are tracking to arrive under 8%, so their last four stops move to a vehicle running 20 drops ahead. Two reassignments now are cheaper than one recovery van at 18:45.
The eight vehicles on tomorrow’s longest routes take wave one; short-route vehicles take wave three. This single habit is what keeps the 05:15 report clean, and it is the most common thing new electric depots get wrong.
Notice what is absent from that day: heroics. Every decision is a rule applied quickly to good data. That is why depot charging management and route data have to sit in one view — a supervisor toggling between a charger portal and a routing tool simply skips the 12:30 decision, and skipping it stays invisible until the quarterly energy bill lands.
A Taxi Fleet Manager’s Day (100 Electric Sedans, Bengaluru)
The taxi manager’s constraint is the opposite of the supervisor’s. His vehicles are not his to sequence — driver-partners take them home, charge them in three different places, and earn by the hour. His headline number is revenue-hours per charge cycle, and almost every decision he makes is about protecting them.
94 of 100 cars are above 80%. The six that are not are the day’s actual work: two drivers did not plug in, three charged on slow home points that reached only 62%, one has a charging fault. Knowing which is which before 06:00 is the difference between six idle cars and one.
Airport runs are 35 km each way plus a queue, so only cars above 55% are eligible — a hard rule in dispatch, not a suggestion. The failure mode is not a slightly late car; it is a driver abandoning a high-value trip mid-shift and blaming the vehicle.
Fourteen sessions ran overnight on a premium fast-charging network at roughly twice the depot rate. Nobody did anything wrong — the depot was full. The fix is policy: publish the approved networks, show drivers the price difference, and add depot capacity where overflow keeps recurring.
Reimbursement settles against metered session data, not a photo of an odometer. Sessions matching a car’s known consumption pass automatically; the three that do not get a look. Automating the honest 95% is what makes it affordable to scrutinise the rest — the mechanics are in our guide to driver home-charging reimbursement.
Revenue-hours per charge cycle, by driver and by vehicle. A car returning 8.5 against a fleet median of 11 is rarely a bad car — it is a charging habit, a route pattern, or a battery worth inspecting. Three questions tonight prevent a month of quiet underperformance.
Taxi fleets bleed value at the edges, not in the middle: energy is bought in three places at three prices. The only reliable defence is one ledger, which is what fleet payment management is for — depot, public and home sessions reconciled against the same cost baseline instead of arriving as three unrelated bills.
A Corporate Transport Coordinator’s Day (40 Cars, 12 Shuttle Vans, Pune)
Corporate transport has the most predictable routes and the least tolerance for failure. Nobody congratulates the coordinator for 40 on-time arrivals; everybody hears about the one shuttle that made 34 engineers late. Her headline number is on-time arrival rate, and her margin of error is measured in minutes.
The roster is fixed the night before; readiness is not. Two vans sit below the 45% dispatch floor for the 62 km Hinjawadi loop. The swap happens at 07:00 with the fleet still in the depot — not at 08:20 with employees already waiting at a pickup point.
Live tracking is not surveillance; it is a twelve-minute head start. A van eight minutes behind at the second pickup is a notification to 30 employees now, or an escalation to HR at 09:30. The technology only buys time — the value comes from spending it early.
An unplanned 16:00 airport drop is accepted only if a vehicle can cover the 96 km round trip and still make the evening shuttle. Answering that two-variable check in 30 seconds rather than 30 minutes is most of why the transport desk gets trusted.
Evening shuttles are topped up before the peak tariff window, not during it. Vehicles that will sit idle until 21:00 are deliberately left unplugged so their ports go to the ones that will not.
Corporate fleets typically touch several charge point operators plus their own depot. Reconciled daily, a discrepancy is a five-minute correction; reconciled monthly, it is an unwinnable argument with a vendor. The approach is in our guide to unified invoicing across multiple CPOs.
This is where fleet analytics stops being a reporting feature and becomes an operating one: the same per-trip energy record that proves an SLA today produces the CO₂ number the sustainability team needs next quarter, with no second data-collection exercise.
The Five Decisions That Repeat In Every EV Fleet Daily Operation
Strip the three days back to their structure and the same five decisions appear in all of them. Only the numbers and the vocabulary change by segment.
| Daily decision | What you are really optimising | The number to look at | Cost of skipping it |
|---|---|---|---|
| Charge sequence | Fitting tomorrow’s energy demand into tonight’s point-hours | kWh required per vehicle by first dispatch | Vehicles start the shift short and lose routes |
| SOC versus route | Margin at the end of the route, not maximum range | State of charge at 60% of route completed | Mid-route recovery trips and cascaded delays |
| Exception triage | Separating the faults that cost money today | Consumption against each vehicle’s own 7-day baseline | Small mechanical faults become breakdowns |
| Payment approval | Knowing your true blended cost per kWh | Depot, public and home ₹/kWh spread | Energy budget leaks quietly at the edges |
| End-of-day reconciliation | Proving the electrification case with evidence | Cost per drop or per revenue-hour, versus 30-day trend | You cannot defend the business case you signed |
The pattern worth noticing: not one of these is a technology decision. They are operating decisions that happen to require data fast enough to act on. When teams tell us their fleet software is not paying for itself, it is almost always because the data arrives after the decision window has closed — the report is accurate on Thursday about a choice that had to be made on Tuesday.
How To Build Your Own Daily Operating Rhythm
If you are moving from a pilot to a real electric shift, do not start by buying more dashboards. Start by writing down the four things below — most fleets can do it in an afternoon, and it makes EV fleet daily operations reproducible by whoever is on duty rather than dependent on your best supervisor.
- Pick one headline number per segment — cost per drop, revenue-hours per charge, or on-time arrival. One. A supervisor optimising four numbers is optimising none of them.
- Write your three thresholds as actual figures — the dispatch floor (“never below 45%”), the reassignment trigger (“projected arrival under 8%”), and the exception trigger (“15% above own baseline”). Numbers are trainable; judgement is not transferable.
- Alert on the exception, never on the metric — a dashboard that shows 60 states of charge shows nothing. A notification that names the three vehicles which will not finish is the whole product.
- Make reconciliation automatic and daily — if closing the day takes a spreadsheet, it will stop happening in week three, and you will lose the only evidence that the transition is working.
Once those four are in place, scale is mostly a copy-paste problem. The teams that struggle at 200 vehicles are rarely the ones with weak strategy — they are the ones who never wrote the shift down, and are now trying to. If you want the escalation structure that sits on top of this rhythm, our EV fleet command center guide covers the alert tiers and review cadence, and the exception handling toolkit covers what to do when the day goes sideways.
Frequently Asked Questions
Sources: IEA — Global EV Outlook 2026, trends in electric two- and three-wheelers | Ministry of Power — Time of Day tariff, Electricity (Rights of Consumers) Amendment Rules | Ministry of Power — revised EV charging infrastructure guidelines and standards
Manage Your Fleet’s Daily Operations Today
See the 05:15 readiness view, the charge-sequencing board, and the one-ledger energy reconciliation that last-mile, taxi and corporate teams run their shifts on — on your own fleet’s numbers.
Book a Free DemoYoMobility EV-FMS
EV fleet management softwareRun every vehicle, driver, charge and payment from one platform. Charge on multiple networks, and get one invoice for all of it.
Resources
Keep reading

Electric Scooter For Delivery Fleets: Specs That Survive A Full Rider Shift
💡 Electric Scooter For Delivery Fleets: Summary An electric scooter for delivery and an electric scooter for commuting are usually […]
PM E-DRIVE Scheme In 2026: What Fleets Can Still Claim And What Already Closed
💡 PM E-DRIVE Scheme: Key Highlights If you are timing an electric vehicle purchase for a commercial fleet, the PM […]
CNG vs EV For Commercial Vehicles: The Comparison Indian Fleets Actually Face
💡 CNG vs EV For Fleets: Key Highlights This is for one reader: the fleet owner replacing a diesel light […]
See YoMobility on your fleet
Tell us how many vehicles you run and where they charge. We'll show you how they'd run on one platform, with one invoice.
Or contact us