
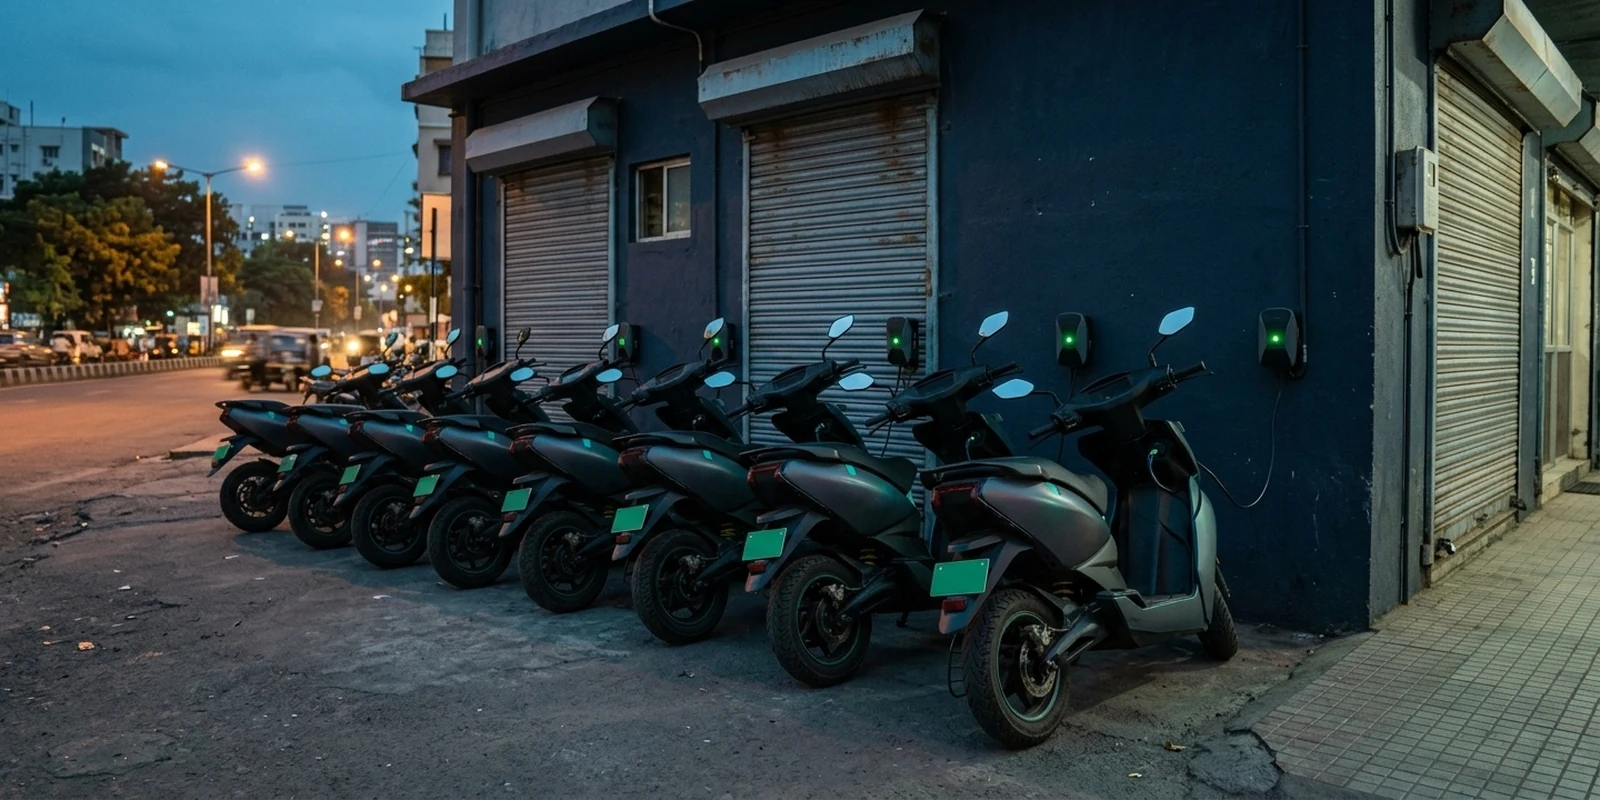
Hyperlocal Delivery Is A Different Duty Cycle
💡 Hyperlocal Delivery: Key Highlights
- A tier 1 dark store needs about 1,300 orders a day to break even — at 30 to 35 orders per rider, that is roughly 40 rider-days of capacity from a single address with no yard.
- A trip is four to six kilometres and about 0.2 kWh. No single trip can strand a rider, so range is not the constraint anyone should be designing around.
- Cumulative energy is the problem: 70 to 110 km over a 14 to 15 hour login exceeds the 2.5 to 3.5 kWh pack on most delivery two-wheelers, and a full AC recharge costs three to four hours off the road.
- Dark-store capex has risen to roughly ₹2.5 crore per store — charging load is rarely in that budget, and a leased retail connection is not a depot connection.
- Rider-owned vehicles carry most of the SLA and give the least telemetry: 250,000 to 300,000 delivery partners against 60,000 to 70,000 store staff.
- Measure energy and cost per drop and availability at peak, not cost per km — energy is under 7% of the marginal cost of a drop.
If you run operations at a quick-commerce or hyperlocal delivery business, or you are the 3PL running someone else’s rider fleet, you have probably been handed an EV plan written for parcel last-mile: daily range, route length, overnight depot charging. Very little of it survives contact with a dark store. India’s three largest quick-commerce platforms took their combined dark-store network from 3,405 to 5,026 locations in the year to May 2026, in a category growing at 40% a year. That network runs on a duty cycle that looks nothing like a delivery van’s.
We have covered the parcel side elsewhere: electric last-mile logistics in India owns the business case for a van fleet, and the last-mile fleet operations checklist owns its daily shift routine. Both assume a depot, a route and a return at the end of the day. This post is about what changes when there is no route at all — when the vehicle leaves the same building thirty times a shift, travels two kilometres, and comes straight back.
Hyperlocal Delivery Is A Different Duty Cycle, Not A Shorter Route
Start with the shape of the work, because every other assumption follows. A parcel van makes one departure and runs a loop: 40 to 60 stops, 80 to 120 km, back at the depot when it is done. A rider working a dark store makes 30 to 40 separate departures from the same node, one to three orders each, over a four to six kilometre round trip. Same word, “delivery”; structurally a different job.
The density behind it sets the fleet size. Emkay Global estimates a dark store needs roughly 1,300 orders a day to break even in a tier 1 city, about 800 in tier 2. Riders describe completing 30 to 35 orders across a 14 to 15 hour login. Divide one by the other and a single break-even store absorbs around 40 rider-days of capacity a day. That is a fleet, at one address, with no yard.
One correction before the operational detail, because it changes how you write the SLA into a contract: the “10-minute” branding was rolled back in January 2026 after the Union Labour Ministry raised worker-safety concerns, and Blinkit changed its tagline accordingly. The claim went; the clock did not. Promised times are still counted in minutes, and it is that clock, not the distance, that creates every constraint below.
| What changes | Parcel last-mile | Hyperlocal delivery |
|---|---|---|
| Trip shape | One departure, a loop of 40–60 stops | 30–40 separate departures, 1–3 drops each |
| Distance | 80–120 km a day, some highway running | 4–6 km round trip, effectively no highway |
| Origin | Depot with a yard and a sanctioned load | Leased retail unit, 2,500–7,000 sq ft |
| Clock | Delivery window measured in hours | Promised time measured in minutes |
| Vehicle | Company-owned van or cargo three-wheeler | Mostly rider-owned or rented two-wheeler |
| Binding constraint | Range and route feasibility | Turnaround and availability at peak |
| Charging | Overnight at the depot; detours cost the route | Opportunity top-ups at the origin, no detour |
Why Range Stops Being The Constraint And Turnaround Becomes It
Take one trip: four to six kilometres round trip on an electric two-wheeler drawing around 30 to 40 Wh per km — check that against your own telematics, not a brochure. That is about 0.2 kWh. No single trip in hyperlocal delivery can strand a rider; the worst case is pushing a scooter two kilometres back to where it started. Per-trip range risk is effectively zero, so designing this fleet around range anxiety is designing around the wrong thing.
The arithmetic that does bite is cumulative. Thirty-five orders, with some batching, still puts a busy rider in the 70 to 110 km band across that long login. At 35 Wh per km that is 2.5 to 3.9 kWh — the entire usable capacity of the 2.5 to 3.5 kWh packs most delivery two-wheelers carry. The pack covers a shift. It does not cover a day.
So the binding limit is not whether the vehicle arrives; it is how many rider-hours the replenishment costs. A full AC recharge on a pack that size takes three to four hours, roughly a quarter of the login spent stationary. And demand is not flat across that login: it concentrates into a midday window and a heavier evening one. A recharge that lands on a peak does not cost you kilowatt-hours. It costs you the order, and the rider’s earnings with it.
That is the inversion against parcel. A van charges overnight because it is parked overnight, so the planning problem is fitting a route inside a battery. Here the problem is fitting a recharge into a day that has no slack in it.
The Charging Model That Fits A Dark Store, Not A Depot
There is a structural advantage here that parcel fleets never get: the vehicle returns to the same node every 10 to 20 minutes. Every rider handover is a charging opportunity with no detour cost — the exact inverse of the parcel problem, where charging means leaving the route.
The difficulty is that the node is a leased retail unit, not a depot. Dark stores have grown from 2,000–3,000 sq ft into 5,000 sq ft and larger, and capex guidance per store has moved to around ₹2.5 crore from about ₹1 crore, with the extra space going into picking aisles, packing stations, rider handover points and staging. Charging load is almost never a line in that budget, and it is the one item that needs a DISCOM rather than a contractor.
Work the numbers before you promise riders anything. Forty riders each needing one 3 kWh replenishment is about 120 kWh a day at the store, and fifteen light-EV AC points at 2 kW adds 30 kW of connected load to a unit whose sanctioned load was set for refrigeration, lighting and packing. Use your own figures; the conclusion holds. On a leased LT commercial connection, a load enhancement is a landlord conversation plus a DISCOM timeline, not a purchase order.
So the pattern that works is a deliberate hybrid. Size the store’s points for the peak-adjacent top-up only, not the whole fleet; push bulk replenishment into off-peak hours when the rider is earning least anyway; and decide explicitly whether you are paying for that energy, because an unpriced charger at a dark store becomes a queue within a week. Battery swapping deserves a mention rather than a re-argument — we have set out the swapping versus plug-in trade-off in its own post. What matters here is that hyperlocal delivery is where that choice carries the most weight, because turnaround is the constraint and swapping takes it off your lease.
Who Owns The Vehicle Decides What You Can Actually See
Three ownership models coexist in hyperlocal delivery, and they produce three different data and cost pictures: riders bring their own vehicles, riders rent or subscribe to one, or the operator owns a fleet. Most operators run a mix, and most of the volume moves on the first two.
The scale sits on the rider side, not the store side. India’s largest platforms employ roughly 60,000 to 70,000 dark-store workers against 250,000 to 300,000 delivery partners, about one to three. NITI Aayog projects the gig workforce reaching 23.5 million by 2029-30, from 7.7 million in 2020-21. The asset base carrying your SLA is overwhelmingly out on the road, owned by somebody else.
That produces the visibility inversion which defines the segment: you hold complete data on the store you control and almost none on the assets that decide whether the order lands. Rider-owned is the most common model and the weakest telemetry — app events only, login, accept, pickup, drop, with nothing about state of charge or battery health. You discover a failing pack when a rider quietly stops accepting orders at 7pm.
Rental and subscription sit in the middle: the rental company holds the telematics and you usually do not, so the contract is the only lever — ask for a per-vehicle data feed at contract time, not after the first bad evening. Company-owned gives full vehicle management visibility and is the model most operators use least, because demand is too peaky to justify assets sized for the evening. Whichever the mix, riders need managing as cohorts, and that belongs in driver management, not a spreadsheet per store.
One current fact changes the own-versus-rent maths: PM E-DRIVE has been extended to 31 March 2028, but the terminal date for registered electric two-wheelers, e-rickshaws and e-3Ws stayed at 31 March 2026 — the extension covers e-trucks, e-buses and testing agencies. A fleet buying delivery two-wheelers today buys them without that demand incentive, which quietly invalidates any ownership case built in 2024.
The Metrics That Matter In Hyperlocal Delivery
Cost per kilometre is the wrong denominator here, and importing it is where parcel thinking does the most damage. A drop is four to six kilometres round trip, about 0.2 kWh; at an LT commercial tariff of roughly ₹8 per kWh that is around ₹1.40 of energy, against rider payouts of ₹20 to ₹30 an order. Energy is under 7% of the marginal cost of a drop. Electrifying still beats petrol on running cost, but it will not move this P&L the way a per-km TCO model built for vans suggests. That model earns its keep on the 100 km parcel route, not the 5 km one.
Three measures do the work instead. Energy and cost per drop, by store and by hour, because that is the only version of energy cost that maps to how you get paid. Vehicle availability at peak — the share of the rider fleet with enough charge to work the evening window, measured at the start of that window rather than averaged across the day. And collisions: how many charge events landed inside a peak. Every one is an order you could not allocate, and it is the number most hyperlocal delivery operations do not currently count.
At one store this is a supervisor’s judgement and it works fine. At 50 stores across four cities, with three ownership models side by side, it is a systems problem: vehicle, charging and rider data have to land in one place before anyone can see that Thursday’s evening SLA misses in one cluster are a charging queue, not a staffing gap. Consolidating that is what a fleet operating system like YoMobility does, and it is worth standing up before the store count makes the pattern invisible.
Frequently Asked Questions
Common questions from operations leads running rider fleets out of dark stores.
The duty cycle, not the speed. A parcel van makes one departure and runs a loop of 40 to 60 stops over 80 to 120 km. A hyperlocal delivery rider makes 30 to 40 separate departures from the same dark store, each a four to six kilometre round trip. That changes the binding constraint from range to turnaround, and it changes where charging has to happen.
For any single trip, comfortably — a four to six kilometre round trip uses roughly 0.2 kWh. Across a full 14 to 15 hour login, 70 to 110 km at about 35 Wh per km draws 2.5 to 3.9 kWh, which is the whole usable capacity of a typical 2.5 to 3.5 kWh delivery pack. So the pack covers a shift but not a day, and the fleet needs a replenishment plan rather than a bigger battery.
Usually both, sized deliberately. Points at the store should cover the peak-adjacent top-up, not the whole fleet: 40 riders needing one 3 kWh replenishment each is about 120 kWh a day, and 15 AC points at 2 kW adds around 30 kW of connected load to a leased unit whose sanctioned load was set for refrigeration and lighting. Push bulk replenishment off-peak, and price the energy explicitly or the points become a queue.
Not on new purchases. PM E-DRIVE has been extended to 31 March 2028, but the terminal date for registered electric two-wheelers, e-rickshaws and e-3Ws remained 31 March 2026 — the extension covers e-trucks, e-buses and testing agencies. Any own-versus-rent business case that assumed the e-2W demand incentive needs rebuilding without it.
Energy and cost per drop broken out by store and by hour; vehicle availability at the start of the evening peak rather than averaged over the day; and the number of charge events that collided with a peak. Energy is under 7% of the marginal cost of a drop, so per-km cost is the wrong denominator — rider-hours and peak availability are where the money is.
Sources: Business Standard — India’s qcom market and dark-store network (Equirus) | Business Standard — Dark-store break-even order density (Emkay Global) | Business Standard — Dark-store capex and store formats (UBS) | Business Standard — Quick-commerce workforce and rider earnings (TeamLease) | PIB — PM E-DRIVE tenure extended to 31 March 2028 (Ministry of Heavy Industries) | NITI Aayog — India’s Booming Gig and Platform Economy
Run Your Hyperlocal Delivery Fleet On One View
Tell us how many dark stores you run and how your riders get their vehicles. We will map the turnaround and peak-availability picture against your own numbers.
- Where your rider fleet actually loses availability at the evening peak
- A charging plan sized to your store’s sanctioned load, not to the fleet
- Energy and cost per drop, by store and by hour
- One view across rider-owned, rented and company-owned vehicles